
Your child’s growth chart may be telling you a lot more than you know right now.
A routine visit to your paediatrician will tell you what your child’s height and weight is. The Indian Academy of Paediatrics has some news dealing with your child’s height and weight. They studied the growth charts for a cross section of boys and girls for eight years from ten to eighteen and found some interesting facts we think you need to sit up and take note of:
- In eight years an average boy from India’s urban upper and middle class grew 3 cms. A girl from the same strata grew only 1 cm.
- Girls are taller earlier but stop growing after puberty, which is arriving much earlier nowadays.
- The most interesting finding is this – Indian children are taller and heavier now than two decades ago pointing to a possible obesity epidemic.
“Boys and girls are heavier than before, and modern India is seeing a huge epidemic of obesity,â€_x009d_ said Vaman Khadilkar, consultant paediatric endocrinologist at Jehangir Hospital, Pune, and convener of the Indian Academy of Pediatrics’ (IAP) growth-chart committee.
Are you using the right tools to track your child’s growth?
In India weight and height measurement is considered a routine ritual that parent’s don’t read much into. But recent studies suggest that parents must play close attention to these charts. A growth chart takes into account your child’s weight and height over a period of time. The parameters are set by observing a vast number of children. The height and weight of your child is usually compared against the average norm to see whether your child is growing as expected.
Doctors use any deviation from the norm to identify growth related disorders or nutritional deficiencies in kids at an early stage. As parents we have all wondered whether our child is eating enough or growing as needed. The answers all lie in these growth charts!
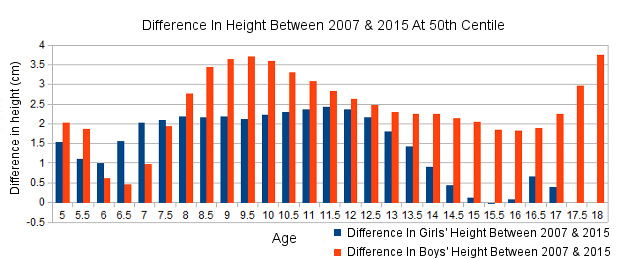
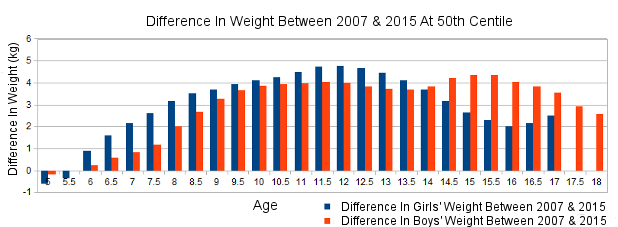
Image Source: www.indiaspend.com
The IAP instead of following charts followed globally has revised the BMI charts keeping in mind the growth of Asian children. They have been developed based on data from children of upper and middle class families drawn from 14 different Indian cities.
Doctors say these charts will be useful to determine whether a child is at risk of being obese and can be diagnosed a lot sooner. The same chart will work to highlight malnourishment in a child as well.
So the next time you visit your child’s paediatrician or record your child’s annual height and weight, make sure to check exactly where your child stands on the curve. It might just tell you something important.
Don’t forget to follow us on Facebook, Twitter & Instagram or subscribe to our Youtube Channel for more information.
Image Source: www.gettyimages.com


